
An aerofoil lift and drag wind tunnel experiment measures the two force components acting on a model aerofoil as air flows over it at a known speed. You mount the aerofoil on a force balance inside the test section, set a steady air velocity, vary the angle of attack in fixed steps, and record the lift and drag forces (or pressures) at each angle. From those readings you calculate the lift coefficient (CL) and drag coefficient (CD) and plot them against angle of attack to study stall behaviour and the lift-to-drag ratio.
This guide gives a clear, repeatable procedure suitable for undergraduate aerodynamics, fluid mechanics, and aeronautical engineering labs in India and abroad, along with the equipment you need, the formulae, a sample observation table, and common sources of error.
Equipment mentioned in this guide
Review the product information, specifications and model before requesting a quotation.
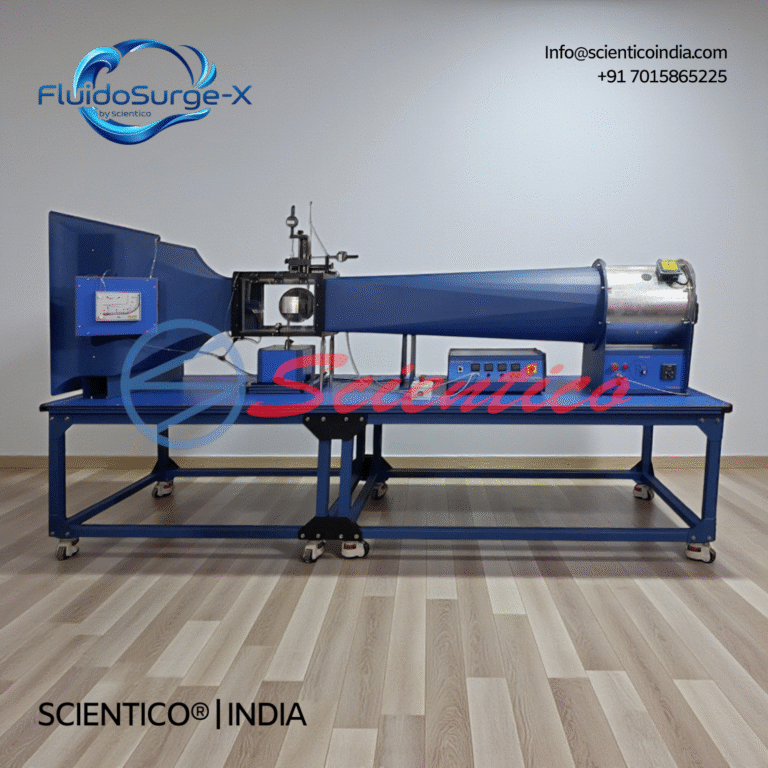
Wind Tunnel | FluidoSurge-X 216
The Wind Tunnel FluidoSurge-X 216 is designed for experimental study of aerodynamic flow and force characteristics on bodies in air. It enables controlled investigation of lift, drag, pressure distribution, and boundary layer behavior. The system uses an Eiffel type open circuit configuration with a transparent measuring section. It is suitable for aerodynamics and fluid mechanics laboratory instruction.
View product detailsWhat equipment do you need for the experiment?
The experiment runs on a subsonic open-circuit (or closed-circuit) wind tunnel with a transparent test section. The core items are listed below. Specifications such as test-section size and maximum velocity vary by tunnel model, so confirm the rating of your specific unit before planning the experiment.
| Component | Function in the experiment |
|---|---|
| Subsonic wind tunnel with test section | Provides a steady, uniform airflow at a controllable velocity over the model |
| Aerofoil model (e.g. a symmetric or cambered section) | The test specimen on which lift and drag are measured |
| Two- or three-component force balance | Resolves the resultant force into lift and drag components |
| Angle-of-attack adjustment (protractor / indexed mount) | Sets and reads the model’s inclination to the flow |
| Pitot-static tube with manometer | Measures free-stream velocity in the test section |
| Manometer bank or pressure transducer (optional) | For the pressure-distribution variant of the experiment |
| Thermometer and barometer | Record air temperature and pressure to compute air density |
Equipment of this type falls under the broader Fluid Mechanics Lab Equipment category that engineering and polytechnic labs typically procure as a set.
What is the theory behind lift and drag?
When air flows over an aerofoil, the pressure difference between the upper and lower surfaces produces a resultant aerodynamic force. This force is resolved into two components relative to the free-stream direction:
- Lift (L): the component perpendicular to the free-stream flow.
- Drag (D): the component parallel to the free-stream flow.
The dimensionless coefficients are defined as:
- Lift coefficient: CL = L / (½ ρ V² A)
- Drag coefficient: CD = D / (½ ρ V² A)
where ρ is air density, V is free-stream velocity, and A is the planform (reference) area of the aerofoil. The free-stream velocity is obtained from the pitot-static reading using V = √(2Δp / ρ), where Δp is the measured dynamic pressure. Air density is found from the ideal gas relation using the recorded temperature and barometric pressure.
What is the step-by-step procedure?
Follow these steps carefully and keep the air velocity constant across the angle sweep so that the only variable is the angle of attack.
- Record ambient air temperature and barometric pressure, and calculate air density.
- Measure and note the chord and span of the aerofoil to compute the reference area A.
- Mount the aerofoil on the force balance and confirm it is secure and aligned. Set the angle of attack to zero (or to the lowest angle in your range).
- Switch on the tunnel and increase the fan speed gradually until the test-section velocity reaches the target value shown by the pitot-static manometer.
- Allow the flow to stabilise, then record the lift and drag readings from the balance (and the manometer bank if you are also taking pressure data).
- Increase the angle of attack in fixed steps (for example 2° or 4°) up to and slightly beyond the stall angle. At each step, let the readings settle and record lift, drag, and velocity.
- Take readings through the stall region carefully, as forces fluctuate when the flow separates.
- Reduce the fan speed gradually to zero and switch off the tunnel.
- Repeat the sweep at least once for a second data set to check repeatability.
Sample observation table
Use a structured table so calculations are easy to verify. Values below are placeholders to show the format, not measured data.
| Angle of attack α (°) | Lift L (N) | Drag D (N) | Velocity V (m/s) | CL | CD | L/D |
|---|---|---|---|---|---|---|
| 0 | – | – | – | – | – | – |
| 4 | – | – | – | – | – | – |
| 8 | – | – | – | – | – | – |
| 12 | – | – | – | – | – | – |
| 16 | – | – | – | – | – | – |
How do you analyse and plot the results?
For each angle of attack, compute CL and CD using the formulae above, then plot the following graphs:
- CL vs angle of attack: rises roughly linearly, then peaks and drops at the stall angle.
- CD vs angle of attack: increases gradually, then sharply once the flow separates.
- CL vs CD (drag polar): shows the trade-off between lift and drag.
- Lift-to-drag ratio (L/D) vs angle of attack: identifies the angle of maximum aerodynamic efficiency.
Students should comment on the stall angle, the maximum CL, and the angle giving the best L/D ratio. Comparing a symmetric aerofoil with a cambered one (if both models are available) makes for a strong discussion section.
What are the common sources of error?
- Misaligned model: a non-zero true angle when the protractor reads zero shifts the whole curve.
- Unsteady velocity: letting the fan speed drift between readings corrupts the coefficients.
- Wall and blockage effects: a model that is too large for the test section distorts the flow.
- Vibration and balance friction: introduce scatter, especially at low forces.
- Reading the manometer at an angle: parallax errors in the dynamic-pressure reading.
- Ignoring air density changes: using a textbook density instead of the value from the day’s temperature and pressure.
Safety and good lab practice
- Keep loose clothing, hair, and tools away from the fan and intake.
- Ramp the fan up and down gradually rather than switching at full speed.
- Confirm the model is locked in place before starting the tunnel.
- Do not exceed the rated maximum velocity of your tunnel.
Sourcing a wind tunnel for your lab
When equipping an aerodynamics or fluid mechanics laboratory, colleges usually specify the tunnel by test-section dimensions, velocity range, and the type of force balance and instrumentation required. Scientico, an ISO 9001:2015 and model-specific manufacturer and exporter based in Ambala, Haryana, India, has supplied engineering teaching equipment since 1993 to institutions across 30+ countries, with calibration and conformity documentation included and GeM registration for Indian government and institutional procurement. For exports, a CIF proforma invoice is typically issued within 24 hours of a clear specification, and technical queries can be discussed over WhatsApp at +91-7015865225.
Whether you are setting up a new lab or adding an aerodynamics bench to an existing one, defining the experiment outcomes first, such as the CL, CD, drag polar, and stall study described above, helps you specify the right tunnel and instrumentation the first time.
Frequently Asked Questions
What is measured in an aerofoil lift and drag wind tunnel experiment?
You measure the lift force (perpendicular to the airflow) and the drag force (parallel to the airflow) acting on a model aerofoil at a known air velocity, taken across a range of angles of attack. From these forces you calculate the lift coefficient (CL) and drag coefficient (CD) and study how they change with angle, including the stall point.
How do you calculate the lift and drag coefficients?
Use CL = L / (0.5 x rho x V^2 x A) and CD = D / (0.5 x rho x V^2 x A), where L and D are the measured lift and drag forces, rho is air density, V is free-stream velocity from the pitot-static reading, and A is the planform area of the aerofoil. Air density is found from the recorded temperature and barometric pressure.
Why does the lift coefficient drop after the stall angle?
As the angle of attack increases, the airflow over the upper surface eventually separates from the aerofoil. This separation causes a sudden loss of the pressure difference that generates lift, so CL peaks and then falls, while CD rises sharply. The angle at which this happens is the stall angle.
What type of wind tunnel is used for this experiment?
A subsonic wind tunnel with a transparent test section is standard for undergraduate aerodynamics and fluid mechanics labs. It can be an open-circuit or closed-circuit design and is fitted with a force balance to resolve lift and drag, plus a pitot-static tube and manometer to measure velocity.
How do I get a quotation for a wind tunnel from Scientico?
Scientico works on a quote basis with no public prices. Share your required test-section size, velocity range, and instrumentation, and a CIF proforma invoice is typically issued within 24 hours for export orders. You can reach the team on WhatsApp at +91-7015865225, and GeM registration is available for Indian institutional procurement.
One honest ask
We don't gate anything on this site. You just read the whole thing free. If it was useful, leave your email and two things happen: we send you this page as a plain-text block you can paste into a tender file or an internal email, and we notify you the next time we publish a buyer tool like this one. Nothing else. No drip sequence, no sales calls booked without asking.