
Creep vs fatigue describes two distinct ways materials fail under load over time. Creep is the slow, time-dependent plastic deformation of a material under a constant stress at elevated temperature, even when that stress is below the yield strength. Fatigue is progressive, localized cracking caused by repeated or fluctuating (cyclic) stress, often at stresses well below the static strength. In short: creep is driven by sustained load plus heat, while fatigue is driven by cyclic loading and the number of stress cycles.
Equipment mentioned in this guide
Review the product information, specifications and model before requesting a quotation.
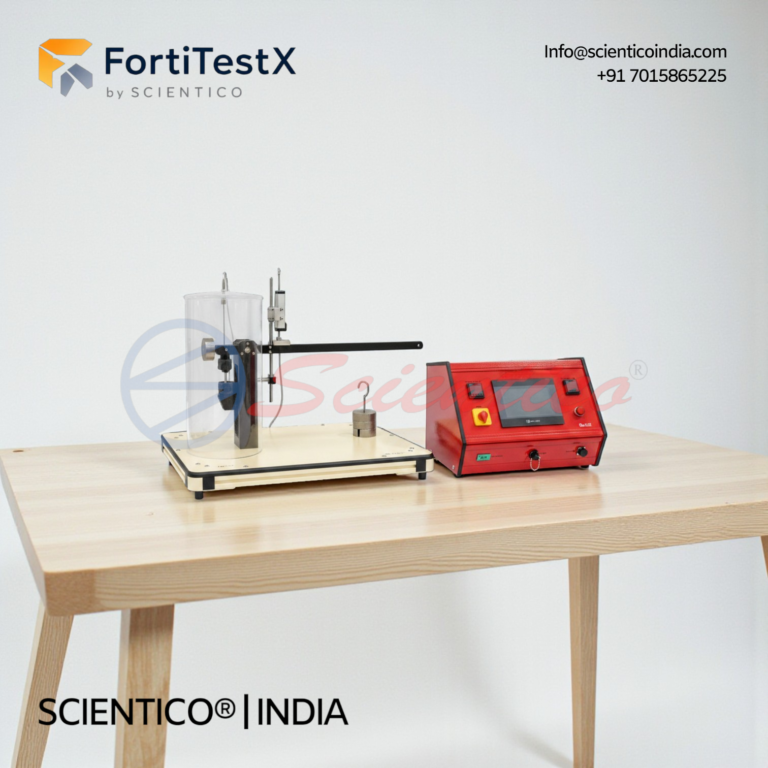
Creep Testing Machine | FortiTestX – 14
Creep Testing Machine FortiTestX 14 is a benchtop strength of materials lab equipment unit designed to demonstrate and investigate the creep behaviour of lead and polypropylene specimens under sustained tensile stress at and below room temperature. This Creep Testing Machine applies load through a transmission lever and dead weight system, measuring specimen displacement via a dial gauge with 0.01 mm resolution across a 0 to 10 mm range. The FortiTestX 14 supports creep rupture testing across a tensile stress range of 2.5 to 35 N/mm², making it a complete creep testing machine strength of materials lab equipment unit for undergraduate engineering and materials science programmes.
View product details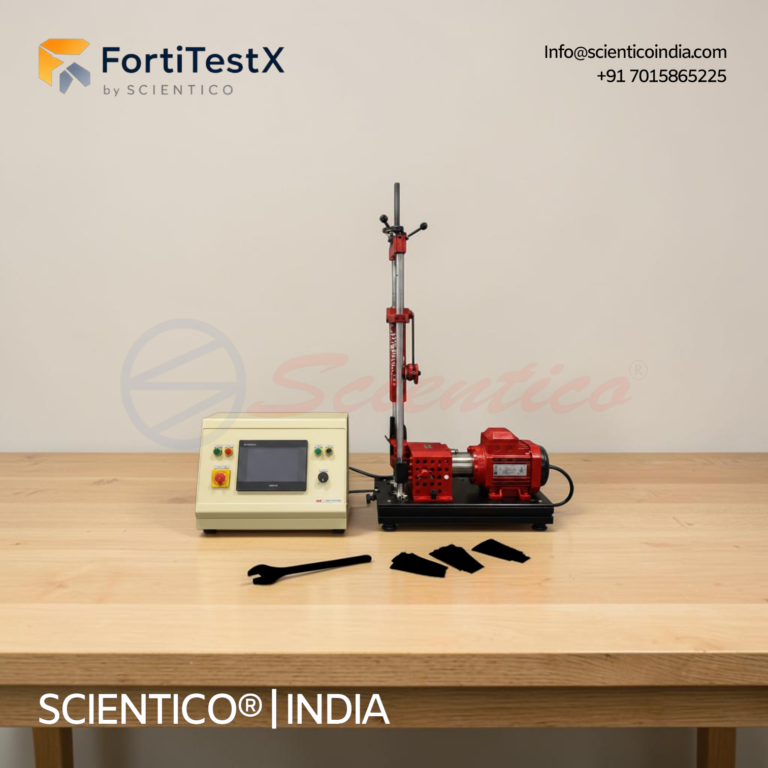
Fatigue Testing Machine | FortiTestX – 22
Fatigue Testing Machine FortiTestX 22 is a benchtop strength of materials lab equipment unit designed for fatigue strength testing of cylindrical metal specimens under cyclic bending load using a rotating cantilever configuration. This Fatigue Testing Machine clamps a revolving metal test bar at one end, applies a controlled point force via a spring balance and moveable plain bearing, and subjects the specimen to a sinusoidal bending stress cycle until fracture, with automatic shutdown triggered by a stop switch integrated into the bearing. The FortiTestX 22 includes an 8-digit electronic load cycle and revolutions counter with contactless inductive speed sensor, making it a complete fatigue testing machine strength of materials lab equipment unit for undergraduate materials testing and failure analysis programmes.
View product detailsWhat is creep?
Creep occurs when a component held under steady stress gradually elongates over hours, days, or years. It becomes significant when the operating temperature exceeds roughly 0.3–0.4 times the material’s absolute melting temperature (T/Tm, the homologous temperature). A classic creep curve plots strain (ε) against time (t) and shows three stages:
- Primary (transient) creep: strain rate decreases as the material work-hardens.
- Secondary (steady-state) creep: a near-constant minimum creep rate; the most important design stage.
- Tertiary creep: strain rate accelerates as voids and necking develop, ending in rupture.
The steady-state creep rate is commonly modelled by the power-law (Norton) relation:
ε̇ss = A · σn · exp(−Q/RT)
where ε̇ss is the steady-state creep rate (s−1), A is a material constant, σ is applied stress (MPa), n is the stress exponent, Q is the activation energy for creep (J/mol), R is the gas constant (8.314 J/mol·K), and T is absolute temperature (K). Typical creep-critical components include turbine blades, boiler tubes, and steam-pipe flanges.
What is fatigue?
Fatigue failure starts at a stress concentration (a notch, surface scratch, or inclusion), where a microcrack nucleates, propagates a little with each cycle, and finally causes sudden fracture once the remaining cross-section can no longer carry the load. The fracture surface often shows characteristic “beach marks” and a final fast-fracture zone.
The governing relationship is the S–N (Wöhler) curve, plotting cyclic stress amplitude (S) against the number of cycles to failure (N). For steels, a fatigue (endurance) limit often appears: below a certain stress amplitude the material can survive effectively infinite cycles. Many non-ferrous metals (e.g. aluminium) show no true endurance limit. Crack growth in the stable region follows the Paris law:
da/dN = C · (ΔK)m
where da/dN is crack growth per cycle (m/cycle), ΔK is the stress-intensity factor range (MPa·√m), and C and m are material constants. Stress range is defined as Δσ = σmax − σmin, with mean stress σm = (σmax + σmin)/2.
Creep vs fatigue: what is the key difference?
The core distinction is the variable that drives damage: time under load and temperature for creep, versus number of load cycles for fatigue. The table below summarizes the main contrasts.
| Parameter | Creep | Fatigue |
|---|---|---|
| Primary driver | Constant stress + elevated temperature | Cyclic / fluctuating stress |
| Time dependence | Strongly time-dependent | Cycle-dependent (not directly time-based) |
| Temperature role | Critical (T/Tm > ~0.3–0.4) | Can occur at room temperature |
| Stress level | Below yield strength | Often well below static strength |
| Deformation | Gradual, measurable elongation | Little bulk deformation until fracture |
| Governing model | Norton power law (ε̇ = Aσne−Q/RT) | S–N curve; Paris law (da/dN = CΔKm) |
| Failure appearance | Necking, voids, intergranular cracking | Beach marks + final fast fracture |
| Typical examples | Turbine blades, boiler tubes | Shafts, axles, springs, bridges |
How do the failure mechanisms differ at the microscopic level?
Understanding the underlying physics helps students connect the macroscopic curves to material behaviour:
- Creep mechanisms: dislocation glide and climb, grain-boundary sliding, and diffusion of atoms/vacancies (Nabarro–Herring and Coble creep). Damage accumulates as cavities form along grain boundaries, leading to intergranular rupture.
- Fatigue mechanisms: cyclic slip produces persistent slip bands at the surface, creating intrusions and extrusions that nucleate a crack. The crack then advances transgranularly, leaving striations, until catastrophic fracture.
In high-temperature cyclic service (e.g. gas turbines), creep-fatigue interaction occurs, where both mechanisms act together and reduce component life below what either predicts alone.
Selection criteria: choosing test equipment for your lab
When specifying machines to demonstrate creep and fatigue for a Strength of Materials or Mechanical Testing laboratory, evaluate:
- Load capacity and range appropriate to your specimen sizes and syllabus.
- Temperature capability for creep rigs (ambient vs furnace-equipped for elevated-temperature creep).
- Frequency and waveform control for fatigue machines (rotating-bend vs axial; reversed, repeated, or fluctuating cycles).
- Measurement and data logging: extensometers, dial gauges, digital strain/cycle counters, and software output for plotting curves.
- Specimen standards conformance (e.g. ASTM/ISO geometries) and easy specimen changeover.
- Safety features: guards, overload cut-offs, and automatic shut-down at fracture.
- Documentation and support: manuals, lab sheets, calibration certificates, and spares availability.
What to ask a supplier: a buyer checklist
- What is the maximum load, and can the machine run both reversed and repeated cycles?
- For creep, what temperature range does the furnace cover, and how is temperature controlled and logged?
- Which specimen standards and dimensions are supported, and are sample specimens included?
- What measurement accuracy and data-acquisition options are provided?
- Is the equipment manufactured under a recognized quality system (e.g. ISO 9001) and does it carry CE marking for export?
- What are the warranty terms, installation/commissioning support, and spare-parts lead times?
- Can you provide a CIF quotation, HS code, and packing details for our country?
How creep and fatigue are shown and measured in a teaching lab
In a typical demonstration, a creep testing machine applies a constant dead-load (often via a lever arm) to a specimen, sometimes inside a furnace. Students record extension against time with a dial gauge or extensometer and plot the three-stage creep curve, then calculate the steady-state creep rate. For fatigue, a rotating-bending fatigue machine spins a specimen under a bending load so each rotation reverses the surface stress; a cycle counter records cycles to failure for several stress levels, and students plot the S–N curve and identify the endurance limit. Together these experiments let learners directly compare time-dependent and cycle-dependent failure.
Scientico India manufactures and exports ISO 9001:2015 and model-specific engineering and science laboratory equipment for these experiments. Explore our full range of Strength of Materials Lab Equipment for your creep and fatigue teaching needs.
Frequently Asked Questions
What is the main difference between creep and fatigue?
Creep is time-dependent plastic deformation under a constant load at elevated temperature, while fatigue is progressive cracking caused by repeated cyclic loading. Creep depends mainly on time and temperature; fatigue depends on the number of stress cycles.
Does fatigue require high temperature like creep?
No. Fatigue can occur at room temperature because it is driven by cyclic stress, not heat. Creep, by contrast, becomes significant only above roughly 0.3 to 0.4 times the material’s absolute melting temperature.
What formulas describe creep and fatigue?
Steady-state creep is modelled by the Norton power law, ε̇ = A·σⁿ·exp(−Q/RT). Fatigue crack growth follows the Paris law, da/dN = C·(ΔK)^m, and fatigue life is characterized by the S–N (Wöhler) curve.
What is creep-fatigue interaction?
At high temperatures under cyclic loading, such as in gas turbines, creep and fatigue act together. This interaction accumulates damage faster than either mechanism alone, reducing component life below individual creep or fatigue predictions.
What equipment demonstrates creep and fatigue in a teaching lab?
A creep testing machine applies a constant dead-load (optionally with a furnace) so students plot strain versus time. A rotating-bending fatigue machine reverses surface stress each rotation, letting students plot the S–N curve and find the endurance limit.
One honest ask
We don't gate anything on this site. You just read the whole thing free. If it was useful, leave your email and two things happen: we send you this page as a plain-text block you can paste into a tender file or an internal email, and we notify you the next time we publish a buyer tool like this one. Nothing else. No drip sequence, no sales calls booked without asking.