
The Refrigeration and Air Conditioning laboratory is a core practical component of B.Tech Mechanical Engineering, Chemical Engineering, and HVAC programmes. Students study the vapour compression cycle, measure COP, analyse the p-h diagram, and study components including compressors, condensers, evaporators, and expansion valves. This guide provides complete procedures for the three most important refrigeration lab experiments.
Experiment 1: Vapour Compression Refrigeration — COP Measurement
Aim
To determine the Coefficient of Performance (COP) of a vapour compression refrigeration system and compare it with the ideal Carnot COP.
Apparatus
- Refrigeration training unit (R-134a or R-404a refrigerant, hermetic compressor, finned condenser, thermostatic expansion valve, evaporator cabinet)
- Digital temperature indicators — at compressor suction, compressor discharge, condenser outlet, evaporator outlet
- Pressure gauges — low side (suction) and high side (discharge)
- Wattmeter (for compressor power input measurement)
- Refrigerant property tables or p-h chart for the refrigerant used
Procedure
- Check the refrigerant charge level and system integrity before starting. Ensure all valves are in the correct position.
- Switch on the refrigeration unit. Allow the system to reach steady state — wait until temperatures and pressures stabilise (approximately 20–30 minutes).
- Record the following at steady state:
— Compressor suction pressure P₁ (kPa) and temperature T₁ (°C)
— Compressor discharge pressure P₂ (kPa) and temperature T₂ (°C)
— Condenser outlet temperature T₃ (°C) — should be subcooled liquid
— Evaporator inlet temperature T₄ (°C) — after expansion valve
— Compressor power input W (Watts) from wattmeter - Using the refrigerant property tables (p-h chart), read off the enthalpies at each state point: h₁ (compressor inlet), h₂ (compressor outlet), h₃ (condenser outlet), h₄ = h₃ (throttling — constant enthalpy).
- Calculate COP and compare with Carnot COP.
- Vary the evaporator load (by adjusting the heater inside the evaporator cabinet) and repeat for 3 different load conditions.
Observation Table
| Parameter | Obs 1 | Obs 2 | Obs 3 |
|---|---|---|---|
| Suction pressure P₁ (kPa) | |||
| Discharge pressure P₂ (kPa) | |||
| Suction temperature T₁ (°C) | |||
| Discharge temperature T₂ (°C) | |||
| Condenser outlet T₃ (°C) | |||
| Evaporator temp T_L (°C) | |||
| Compressor power W (W) | |||
| Evaporator heater load Q_E (W) |
Calculations
From p-h chart or tables: read h₁, h₂, h₃, h₄ = h₃
Refrigerating effect: q_E = h₁ − h₄ (kJ/kg)
Work of compression: w_c = h₂ − h₁ (kJ/kg)
Heat rejected at condenser: q_C = h₂ − h₃ (kJ/kg)
Theoretical COP: COP_th = q_E / w_c = (h₁ − h₄)/(h₂ − h₁)
Actual COP: COP_actual = Q_E / W_compressor (from heater watts / wattmeter watts)
Carnot COP: COP_Carnot = T_L / (T_H − T_L) where T in Kelvin
Refrigerating efficiency: η_R = COP_actual / COP_Carnot × 100%
Sample Calculation (R-134a)
At steady state (from p-h chart for R-134a):
P₁ = 3.0 bar (suction) → T_sat = 0°C → T₁ = 5°C (5°C superheat)
P₂ = 12.0 bar (discharge) → T₂ = 65°C (superheated)
T₃ = 38°C (subcooled by 2°C at condenser exit)
h₁ = 398 kJ/kg, h₂ = 435 kJ/kg, h₃ = h₄ = 260 kJ/kg
q_E = 398 − 260 = 138 kJ/kg
w_c = 435 − 398 = 37 kJ/kg
COP_th = 138/37 = 3.73
T_L = 0 + 273 = 273 K; T_H = 40 + 273 = 313 K
COP_Carnot = 273/(313−273) = 6.83
Refrigerating efficiency = 3.73/6.83 × 100% = 54.6%
Experiment 2: Determination of Dryness Fraction — Separating and Throttling Calorimeter
Aim
To determine the dryness fraction (quality) of wet steam using a separating and throttling calorimeter.
Theory
Wet steam is a mixture of saturated vapour and saturated liquid. The dryness fraction x = m_vapour / (m_vapour + m_liquid). A value of x = 1 means dry saturated steam; x = 0 means saturated liquid. The separating calorimeter mechanically separates the water droplets; the throttling calorimeter superheats the remaining steam so its state can be determined.
Combined dryness fraction: x = x_s × x_t + (1 − x_s)
where x_s = dryness after separator, x_t = dryness through throttling valve
Apparatus
- Steam separating calorimeter
- Throttling calorimeter (with pressure gauge and thermometer)
- Steam supply line with isolating valves
- Condensate collecting vessel (graduated) and stopwatch
- Barometer (for atmospheric pressure)
Procedure
- Allow steam to flow through the separating calorimeter at the main line pressure P₁. Note P₁ and the temperature.
- After separator, steam passes through the throttling valve to a lower pressure P₂ (close to atmospheric). Note P₂ and the throttled steam temperature T₂.
- From the steam tables, read h₂ (enthalpy of superheated steam at P₂, T₂).
- Collect condensate from the separator (m_s) over a timed period using the graduated vessel.
- Collect condensate from the calorimeter outlet (m_c) over the same period.
- Calculate dryness fraction x_t = (h₂ − h_f1) / h_fg1 at pressure P₁, where h_f1 and h_fg1 are from steam tables at P₁.
- Calculate combined dryness: x = (m_c × x_t) / (m_s + m_c)
Experiment 3: Air Conditioning Unit — Psychrometric Analysis
Aim
To study the working of a window/split air conditioning unit and plot the air conditioning process on a psychrometric chart.
Measurements Required
- Return air (room) DBT (dry bulb temperature) and WBT (wet bulb temperature)
- Supply air DBT and WBT at the unit outlet
- Air flow rate through the unit (using an anemometer at the supply grille)
- Refrigerant suction and discharge pressures
- Compressor power input (wattmeter)
Psychrometric Properties
From the psychrometric chart or ASHRAE tables, read at each measurement point:
DBT, WBT → Specific humidity W (kg/kg dry air) → Enthalpy h (kJ/kg dry air) → Relative humidity RH%
Cooling capacity: Q = ṁ_air × (h_return − h_supply) kW
where ṁ_air = air mass flow rate (kg/s) = ρ_air × V̇ (volume flow from anemometer)
Sensible Heat Ratio: SHR = Q_sensible / Q_total = (1.0216 × ṁ_air × ΔDBT) / Q_total
Energy Efficiency Ratio (EER): EER = Q_cooling (BTU/hr) / P_compressor (Watts) — converted using 1 kW = 3412 BTU/hr
Viva Questions
- What is the function of the expansion valve in a vapour compression system?
- Why is the COP of an actual refrigeration system always less than the Carnot COP?
- What effect does condensing temperature have on COP?
- Define dryness fraction. What is its significance for steam turbines?
- What is the difference between DBT and WBT? Why does WBT indicate humidity?
- What is EER? How does it differ from COP?
- Why is R-134a used instead of R-12 in modern refrigeration systems?
Scientico India manufactures this and the full range of Process Engineering equipment — CE-certified and supplied to engineering colleges worldwide.
Lab Equipment Featured in This Guide
Manufactured in-house by Scientico India — ISO 9001:2015 & CE certified, exported to 60+ countries. Request a CIF quote within 24 hours.
 Cavitations Apparatus | FluidoSurge-X 184View details & get quote →
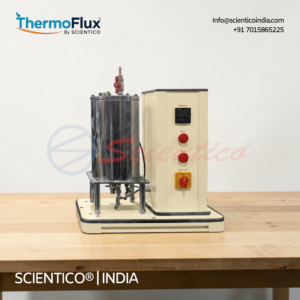 Small Steam Generator | ThermoFlux-24View details & get quote →
 Venturi Meter Apparatus | FluidoSurge-X 176View details & get quote →
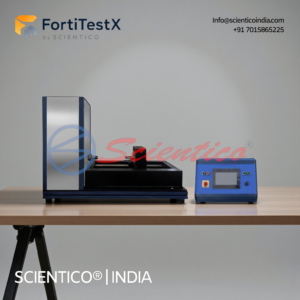 Torsion Testing Machine 300 Nm Motorised | FortiTestX – 10View details & get quote →
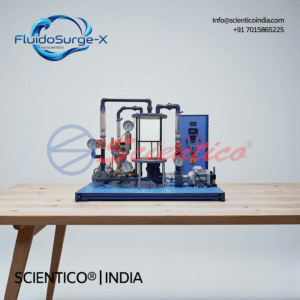 Multi Pump Test Rig Apparatus | FluidoSurge-X 294View details & get quote →
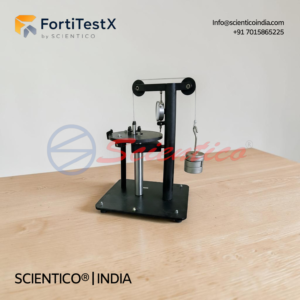 Combined Bending and Torsion Apparatus | FortiTestX 04View details & get quote →