
Refrigeration Cycle Experiment: Procedure, COP Calculation, and P-H Diagram
The refrigeration cycle experiment on a vapour compression refrigeration unit allows engineering students to analyse the complete refrigeration cycle — compressor, condenser, expansion valve, and evaporator — measuring pressures, temperatures, and power consumption to determine the Coefficient of Performance (COP) and compare it with the ideal Carnot COP. This guide covers theory, apparatus, procedure, observation table, and P-H diagram construction for engineering laboratory use.
Theory: Vapour Compression Refrigeration Cycle
The standard vapour compression cycle operates on four processes:
- 1→2 Compression: Refrigerant vapour is compressed adiabatically — pressure and temperature rise
- 2→3 Condensation: High-pressure vapour condenses to liquid in the condenser, rejecting heat Q_H to surroundings
- 3→4 Expansion: Liquid refrigerant expands through a throttle valve — pressure and temperature drop
- 4→1 Evaporation: Low-pressure refrigerant evaporates in the evaporator, absorbing heat Q_L (the refrigeration effect)
Refrigeration effect: Q_L = m × (h₁ – h₄) kW
Compressor work: W = m × (h₂ – h₁) kW
Actual COP: COP = Q_L / W
Carnot COP (ideal): COP_Carnot = T_L / (T_H – T_L)
Apparatus Description
Scientico India’s Refrigeration Training Unit consists of:
- Hermetically sealed compressor (R-134a or R-22 refrigerant)
- Air-cooled or water-cooled condenser
- Thermostatic expansion valve (TEV) and sight glass
- Evaporator with calorimeter for refrigeration effect measurement
- High and low side pressure gauges (compound gauge)
- Thermocouple array at compressor inlet/outlet, condenser outlet, evaporator outlet
- Wattmeter for compressor power input
- P-H chart for refrigerant for plotting the cycle
Experimental Procedure
- Start the refrigeration unit and allow system to reach steady state (10–15 minutes)
- Record high-side pressure P₂ (condenser) and low-side pressure P₁ (evaporator)
- Record temperatures: T₁ (compressor suction), T₂ (compressor discharge), T₃ (condenser outlet), T₄ (evaporator inlet)
- Record compressor power input W from wattmeter (watts)
- If calorimeter is fitted: measure water flow rate and temperature rise to calculate Q_L directly
- Use refrigerant P-H chart to read enthalpy values h₁, h₂, h₃, h₄ at the measured pressures and temperatures
- Calculate refrigeration effect Q_L, compressor work W, COP_actual, and COP_Carnot
- Repeat at 2–3 different condenser temperatures (vary cooling water or load)
Observation Table
| Parameter | Run 1 | Run 2 | Run 3 |
|---|---|---|---|
| Low-side pressure P₁ (bar) | |||
| High-side pressure P₂ (bar) | |||
| Suction temp T₁ (°C) | |||
| Discharge temp T₂ (°C) | |||
| Condenser outlet T₃ (°C) | |||
| Evaporator inlet T₄ (°C) | |||
| Compressor power W (W) | |||
| h₁ (kJ/kg) | |||
| h₂ (kJ/kg) | |||
| h₃ = h₄ (kJ/kg) | |||
| Q_L (kW) | |||
| COP_actual | |||
| COP_Carnot |
P-H Diagram Construction
- Plot points 1 (h₁, P₁), 2 (h₂, P₂), 3 (h₃, P₂), 4 (h₄, P₁) on the refrigerant P-H chart
- Connect: 1→2 (vertical compression line), 2→3 (horizontal condensation), 3→4 (vertical throttling), 4→1 (horizontal evaporation)
- Identify the two-phase (wet) region and superheat region on the diagram
- Compare actual cycle to ideal (no superheating, no subcooling) cycle
Viva Questions
- Why is the COP_actual always less than COP_Carnot?
- What is superheat in the refrigeration cycle and why is it desirable?
- How does increasing the condenser temperature affect COP?
- What is the function of the sight glass in a refrigeration system?
- Compare vapour compression and vapour absorption refrigeration systems
Get a Quote
Scientico India exports CE-certified Refrigeration Training Units to engineering colleges in UAE, Saudi Arabia, Kenya, Malaysia, Bangladesh, Philippines, and 60+ countries. Contact [email protected] for a proforma invoice within 24 hours.
{“@context”:”https://schema.org”,”@type”:”HowTo”,”name”:”Refrigeration Cycle Experiment — COP Calculation and P-H Diagram”,”description”:”Procedure to determine the coefficient of performance (COP) of a vapour compression refrigeration system and plot the P-H (Mollier) diagram.”,”totalTime”:”PT2H”,”step”:[{“@type”:”HowToStep”,”position”:1,”name”:”Setup and Pre-run”,”text”:”Check refrigerant charge level and oil level. Ensure all thermocouple and pressure gauge connections are secure. Run the refrigeration unit for 15-20 minutes with no external load to stabilize.”},{“@type”:”HowToStep”,”position”:2,”name”:”Record Operating Conditions”,”text”:”At steady state, record: suction pressure (P₁), discharge pressure (P₂), suction temperature (T₁), discharge temperature (T₂), condenser outlet temperature (T₃), and evaporator outlet temperature (T₄).”},{“@type”:”HowToStep”,”position”:3,”name”:”Read Power Input”,”text”:”Record the compressor power input using the wattmeter (kW). Note the running current from the ammeter.”},{“@type”:”HowToStep”,”position”:4,”name”:”Apply Refrigerating Load”,”text”:”Switch on the heaters in the evaporator test section to apply a known load Q_evaporator (W). Maintain for 10-15 minutes until steady state.”},{“@type”:”HowToStep”,”position”:5,”name”:”Calculate Refrigerating Effect”,”text”:”From the P-H chart for the refrigerant (R134a or R22): locate states 1, 2, 3, 4 on the P-H diagram. Refrigerating effect RE = h₁ – h₄ (kJ/kg). Work of compression W = h₂ – h₁.”},{“@type”:”HowToStep”,”position”:6,”name”:”Calculate COP”,”text”:”COP_actual = Q_evaporator / P_input (compressor power). COP_theoretical = RE / W = (h₁ – h₄) / (h₂ – h₁). Ideal Carnot COP = T_evap / (T_cond – T_evap). Compare actual, theoretical, and Carnot COP.”},{“@type”:”HowToStep”,”position”:7,”name”:”Plot P-H Diagram”,”text”:”On the P-H diagram (Mollier chart) for the refrigerant, plot the four state points and connect: isothermal condensation (2→3), isenthalpic expansion (3→4), isothermal evaporation (4→1), isentropic compression (1→2). Label all state points with recorded values.”}]}Get Specifications & Pricing
Scientico India manufactures CE-certified, ISO 9001:2015-compliant laboratory apparatus for universities and institutions. Contact us for full specifications, pricing, and documentation.
WhatsApp: +91 701-586-5225 | [email protected] | FAQ — Shipping, Payment & Warranty
Scientico India manufactures this and the full range of Heat Transfer & Thermodynamics equipment — CE-certified and supplied to engineering colleges worldwide.
Explore Heat Transfer & Thermodynamics Equipment → or request a quoteLab Equipment Featured in This Guide
Manufactured in-house by Scientico India — ISO 9001:2015 & CE certified, exported to 60+ countries. Request a CIF quote within 24 hours.
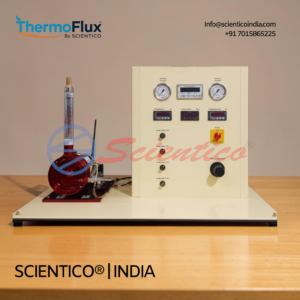 Air Flow Impulse Turbine | ThermoFlux – 7095View details & get quote →
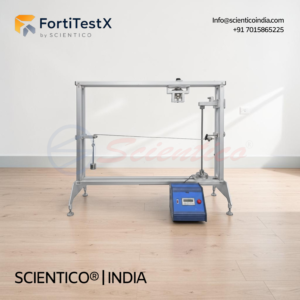 Buckling of Bars | FortiTestX-44View details & get quote →
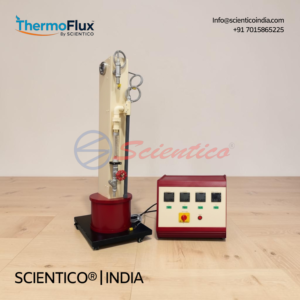 Exhaust Gas Calorimeter ThermoFlux – 7105View details & get quote →
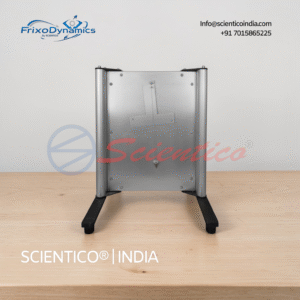 Centre of Gravity Apparatus | FrixoDynamics FX-504View details & get quote →
 Orifice Flowmeter | FluidoSurge-X 232View details & get quote →
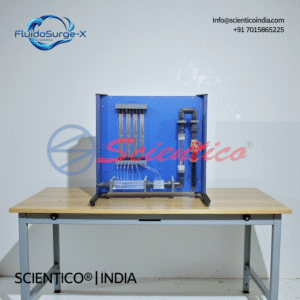 Flowmeter Measurement Apparatus | FluidoSurge-X 136View details & get quote →
Разумное отношение к азарту — это подход к казино, базирующийся на самоограничении и осознании последствий.
Она подразумевает осознанное ограничение продолжительности и бюджета на процесс.
Каждый участник должен предварительно устанавливать лимиты потерь и строго их соблюдать.
https://mindful.worldsfashion.ru/6Jv4kUYbyVST/
Осознанный гемблинг — это принцип к игровым развлечениям, базирующийся на контроле и понимании последствий.
Она предполагает добровольное ограничение времени и расходов на игру.
Любой игрок обязан заранее устанавливать пределы потерь и строго их придерживаться.
https://film.urban-moda.ru/jbKJuWa5wlCT/
Разумное отношение к азарту — это подход к азартным сессиям, основанный на самоограничении и осознании последствий.
Она включает добровольное лимитирование продолжительности и расходов на процесс.
Любой игрок обязан заранее определять лимиты ставок и неукоснительно их соблюдать.
https://list.superlooks.ru/gqaqeSzYeztz/
Ответственная игра — это принцип к казино, базирующийся на самоограничении и понимании последствий.
Она включает добровольное лимитирование продолжительности и расходов на процесс.
Каждый игрок обязан заранее устанавливать пределы потерь и неукоснительно их соблюдать.
https://a1.megakazan.ru/5BQovzfuT4bg/
Осознанный гемблинг — это принцип к казино, базирующийся на контроле и осознании рисков.
Она предполагает добровольное лимитирование времени и денег на игру.
Любой участник обязан заранее определять пределы потерь и неукоснительно их соблюдать.
https://beautyblog.urban-moda.ru/PAgUPnYIUMFR/
Модели Dolce&Gabbana — это удачный союз итальянской элегантности и современных веяний.
Главной особенностью данных кроссовок является яркий внешний вид с сочетанием качественных материалов и узнаваемой отделки.
Такие модели прекрасно смотрятся для городской носки, добавляя в образ долю элегантности.
https://liveforsport.ru/full-text/1635-trendovye-stili-krossovok-dolce-andamp-gabbana-v-2024-godu-chto-aktualno-na-ulitsakh.html
Кеды Dolce&Gabbana — это идеальный союз итальянской классики и актуальных направлений.
Главной чертой данных моделей является запоминающийся внешний вид с использованием дорогих тканей и фирменной фурнитуры.
Эти кроссовки великолепно смотрятся для ежедневной жизни, привнося в стиль штрих шика.
https://rosotels.ru/detail/2026-07-12-bachevsk-v-rukakh-rf-ukreplenie-pozitsiy-na-sumskom-napravlenii.htm
Конторы дают возможность делать пари на различные матчи.
Важно выбирать лицензированных операторов, а также внимательно анализировать роспись перед заключением ставки.
Беттинг могут быть увлекательным досугом, однако важно придерживаться меру ответственной игры и ограничивать расходы.
https://mindset.ullafashion.ru/Ll4oqqSpeFlM/
הפלטפורמה הזה מעניק מגוון רחב של תכנים המיועדים למשתמשים המקומי.
בפלטפורמה תוכלו לגלות תוכן ייחודיים בתחום למבוגרים ברמה גבוהה.
האתר נותנת אפשרות פשוטה לתכנים הללו באמצעות הקפדה על פרטיות המשתמש.
https://hasfaniyot.net/
האתר הזה מציע מגוון רחב של שירותים המותאמים למשתמשים המקומי.
בפלטפורמה תוכלי למצוא תכנים מגוונים בנושא המבוגרים ברמה מעולה.
השירות נותנת אפשרות קלה לשירותים אלה באמצעות הקפדה על פרטיות המשתמש.
https://hasfaniyot.net/
Онлайн-слоты — являются самые популярные развлечения в онлайн-казино.
Их главное преимущество — простота, красочная визуализация и разнообразие дополнительных возможностей.
Пользователи в состоянии подбирать слоты по сюжету, числу барабанов и размеру отдачи.
https://n5.sneakero.ru/gQ9CxreA8uk2/
Онлайн-слоты — являются самые популярные развлечения в онлайн-казино.
https://food.balmain1.ru/8570SGO0PELT/
Игровые автоматы — это одни из самых популярные развлечения в гемблинг-индустрии.
https://societyblog.permgorod.ru/T2w2f1Mjktrt/
Онлайн-слоты — являются самые популярные игры в казино.
https://n6.vladtoday.ru/2kwQZanjh0cL/
На данном сайте вы сможете обнаружить обилие полезной информации.
https://online-festival.ru/detail/3450-treyler-begemot-pedro-paskal-vozvrashchaetsya-k-kornyam-muzyki.html
На данном ресурсе есть возможность найти обилие нужной материалов.
https://km-sochi.ru/news/2026-07-20-prognoz-trendov-kakie-modeli-krossovok-dolce-and-gabbana-budut-populyarny-v-sleduyushchem-sezone/
A generic medication is a product that is created to mirror a pioneer drug in strength, quality, and effectiveness.
It includes the exact active substance as the reference product, however can vary in inactive ingredients and cost.
To be approved, a generic must establish therapeutic equivalence to the innovator medicine, ensuring that it is as safe and potent.
tadacip reddit
A generic version is a formulation that is produced to be identical a innovator drug in dosage, quality, and effectiveness.
Such a drug contains the exact active substance as the original drug, but can vary in inactive ingredients and cost.
For approval, a generic must prove bioequivalence to the innovator product, ensuring it is just as safe and effective.
lady era flushing
A generic pharmaceutical is a product that is developed to mirror a innovator product in potency, quality, and performance.
This product contains the same therapeutic component as the branded drug, however can vary in excipients and price.
To be approved, a copy must demonstrate bioequivalence to the innovator medicine, ensuring it is just as safe and potent.
iMedix trusted pharmacy