
Equipment mentioned in this guide
Review the product information, specifications and model before requesting a quotation.

Hydraulic Bench with Series and Parallel Pumps | FluidoSurgeX 104
The Hydraulic Bench with Series and Parallel Pumps FluidoSurgeX 104 by SCIENTICO is designed for detailed study of centrifugal pump performance in fluid mechanics laboratories.The system enables operation of two centrifugal pumps in single, series, or parallel configurations within a closed water circuit.It supports volumetric flow measurement, pressure monitoring, and weir experiments on an integrated work surface.The apparatus is intended for structured academic instruction and practical laboratory experimentation.
View product details
Series and Parallel Pump Apparatus | FluidoSurge-X 192
The Series and Parallel Pump Apparatus FluidoSurge-X 192 is designed for experimental study of centrifugal pump operation in single, series, and parallel configurations. It enables detailed analysis of head, discharge, and efficiency characteristics under controlled conditions. The system operates in a closed loop and supports variable speed operation. It is suitable for fluid mechanics and hydraulic machinery laboratories.
View product details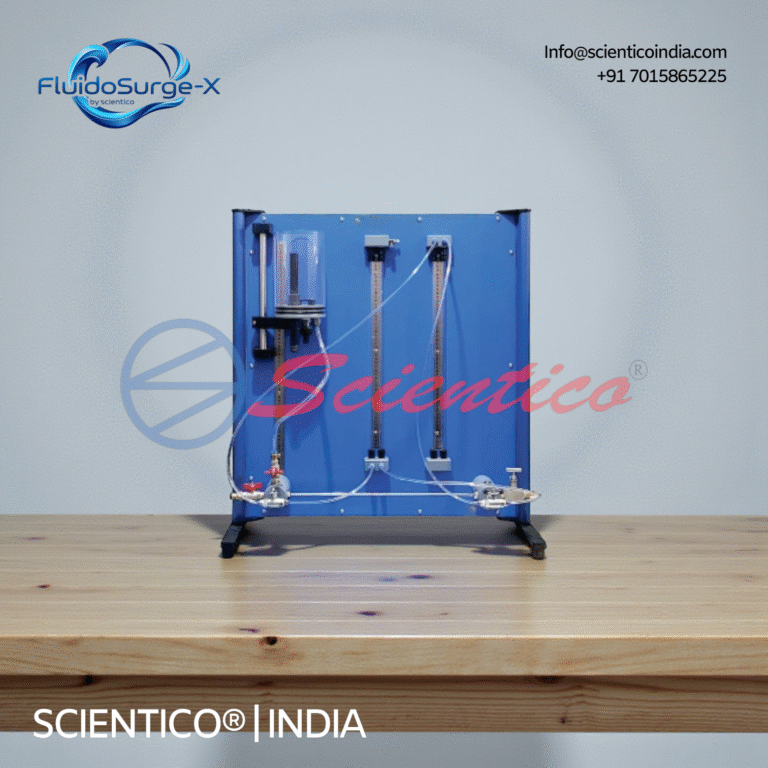
Pipe Friction Apparatus | FluidoSurge-X 168
The Pipe Friction Apparatus FluidoSurge-X 168 is designed for experimental determination of friction losses in pipe flow. It enables study of both laminar and turbulent flow regimes under controlled conditions. The apparatus allows measurement of head loss and determination of critical Reynolds number. It is suitable for fluid mechanics laboratory instruction and experimental analysis.
View product detailsAim of the Experiment
- To determine the performance characteristics (Head vs Discharge, Q vs Efficiency) of centrifugal pumps operating individually, in series, and in parallel
- To compare the effect of series and parallel configurations on total head and flow rate
Theory
When pumps are connected in series or parallel, the combined performance differs from that of a single pump:
Pumps in Series
The total head increases while the flow rate stays the same as a single pump. The combined H-Q curve is obtained by adding the head values of each pump at the same flow rate:
Hseries = H₁ + H₂ (at same Q)
Series configuration is used when high head is required at moderate flow, e.g., booster pumps in tall buildings.
Pumps in Parallel
The total flow rate increases while the head stays the same. The combined Q-H curve is obtained by adding flow rates at the same head:
Qparallel = Q₁ + Q₂ (at same H)
Parallel configuration is used when high flow rate is required at the same head, e.g., water distribution networks.
Apparatus
- Multi-pump test rig (FluidoSurge-X-192) with two identical centrifugal pumps
- Manifold piping system with valves for series/parallel switching
- Pressure gauges at pump inlet and outlet
- Flow meter (rotameter or electromagnetic)
- Wattmeter or power analyser for shaft power measurement
- Control valve on delivery line for varying flow resistance
Procedure
Single Pump Characteristics
- Configure the valve arrangement for single pump operation. Keep Pump 1 running; isolate Pump 2.
- Fully open the delivery valve. Record flow rate (Q), inlet pressure (Pi), outlet pressure (Po), and power input (Pw).
- Gradually close the delivery valve in steps to reduce flow rate. At each step, record Q, Pi, Po, and Pw.
- Continue until the delivery valve is fully closed (shut-off head condition, Q = 0).
- Calculate head at each point: H = (Po − Pi) / ρg + velocity head difference.
Pumps in Series
- Reconfigure the valve manifold to connect both pumps in series (outlet of Pump 1 feeds inlet of Pump 2).
- Start both pumps. Repeat the same procedure, vary delivery valve position and record readings at 6–8 flow rates.
Pumps in Parallel
- Reconfigure the valve manifold for parallel connection (both pump outlets join a common delivery header).
- Start both pumps. Record Q, pressure, and power at each delivery valve position as before.
Observation Table
| Config | Q (L/min) | Pi (bar) | Po (bar) | H (m) | Pw (W) | η (%) |
|---|---|---|---|---|---|---|
| Single | ||||||
| Series | ||||||
| Parallel | ||||||
Calculations
Total Head: H = (Po − Pi) × 10 / ρg (m of water, when pressures in bar)
Hydraulic Power Output: Ph = ρgQH (W)
Overall Efficiency: η = Ph / Pw × 100%
Graph
Plot three H-Q curves on the same graph (Single, Series, Parallel). Observations:
- Series curve: same shape as single pump curve but shifted vertically upward (doubled head at each Q)
- Parallel curve: same shape but shifted horizontally to the right (doubled Q at each H)
Precautions
- Never run centrifugal pumps dry, ensure the system is primed before starting.
- Open the delivery valve before starting pumps in series to avoid pressure build-up.
- Change flow rates slowly and allow the system to stabilise before recording readings.
- Check that both pumps rotate in the correct direction.
Scientico India manufactures this and the full range of Fluid Mechanics Lab equipment, model-specific and supplied to engineering colleges worldwide.