
The fatigue testing experiment is a critical Strength of Materials and Material Science practical that determines how engineering materials behave under repeated cyclic loading. Most mechanical failures in service — shafts, axles, springs, gears, aircraft components — are fatigue failures caused by fluctuating stresses far below the static ultimate strength. Understanding fatigue is essential for safe mechanical design.
Aim of the Experiment
To determine the fatigue strength (endurance limit) of a given material specimen using a rotating-beam fatigue testing machine, and to plot the S-N curve (stress vs. number of cycles to failure).
Theory
What is Fatigue?
Fatigue is the progressive, localised, permanent structural damage that occurs when a material is subjected to cyclic loading. Fatigue failure occurs in three stages: crack initiation (usually at a surface defect or stress concentration), crack propagation (the crack grows with each load cycle), and final fracture (when the remaining cross-section can no longer support the load).
The S-N Curve
The S-N curve (also called the Wohler curve) plots the stress amplitude (S) against the number of cycles to failure (N) on a logarithmic scale. Key features:
- For ferrous metals (steel): The curve flattens to a horizontal asymptote called the endurance limit or fatigue limit. Below this stress, the material can theoretically sustain infinite cycles without failure (typically defined at 10 to the 6th or 10 to the 7th cycles).
- For non-ferrous metals (aluminium, copper): There is no true endurance limit. The S-N curve continues to slope downward. The fatigue strength is defined at a specified number of cycles (e.g., 5 x 10 to the 8th cycles).
Types of Cyclic Stress
- Fully reversed (R = -1): Stress alternates equally between tension and compression (rotating-beam test)
- Repeated (R = 0): Stress varies from zero to a maximum tensile value
- Fluctuating: Stress varies between two non-zero values
Factors Affecting Fatigue Strength
- Surface finish — rough surfaces initiate cracks earlier (polished specimens last longer)
- Stress concentration — notches, holes, fillets, keyways drastically reduce fatigue life
- Size effect — larger components have lower fatigue strength
- Corrosion — corrosive environment accelerates fatigue (corrosion fatigue)
- Residual stresses — compressive residual stress (from shot peening) improves fatigue life
- Temperature — elevated temperature generally reduces fatigue strength
Apparatus Required
- Rotating-beam fatigue testing machine (cantilever or four-point loading type)
- Standard specimens (polished, hourglass profile, typically 8 mm minimum diameter)
- Calibrated weights for applying bending load
- Revolution counter (records cycles to failure)
- Micrometer (for measuring specimen diameter)
- Variable speed motor with controller
Procedure
- Measure the diameter of the specimen at the test section with a micrometer.
- Mount the specimen in the rotating-beam machine chuck. Ensure it is concentric and properly aligned.
- Apply a known bending load W to produce a calculated maximum bending stress. The bending stress for a rotating cantilever is: sigma = 32WL / (pi x d cubed), where L = moment arm, d = specimen diameter.
- Set the revolution counter to zero. Start the machine at the rated speed (typically 1400-3000 rpm).
- As the specimen rotates under the bending load, every point on the surface experiences fully reversed stress (tension to compression each revolution).
- Run until the specimen fractures. Record the number of cycles N to failure from the revolution counter.
- Repeat with fresh specimens at progressively lower stress levels (reduce the load each time).
- Plot stress S (y-axis) vs. log N (x-axis) to obtain the S-N curve. The stress at which the curve becomes horizontal is the endurance limit.
Observation Table
| Specimen | Diameter d (mm) | Load W (N) | Bending stress S (MPa) | Cycles to failure N | log N |
|---|---|---|---|---|---|
| 1 | |||||
| 2 | |||||
| 3 | |||||
| 4 | |||||
| 5 |
Typical Endurance Limits
| Material | Ultimate Tensile Strength (MPa) | Endurance Limit (MPa) | Ratio (Se/Su) |
|---|---|---|---|
| Mild steel | 400-550 | 200-275 | ~0.5 |
| Alloy steel | 800-1200 | 400-550 | ~0.45 |
| Aluminium alloy | 200-500 | 90-150 (at 5×10^8) | ~0.3-0.4 |
| Cast iron | 150-400 | 60-150 | ~0.4 |
Result
The endurance limit of the tested material was found to be _____ MPa, occurring at approximately _____ cycles where the S-N curve becomes horizontal. This is approximately ___ times the ultimate tensile strength, consistent with the typical Se/Su ratio of 0.4-0.5 for steel.
Viva Questions
- What is fatigue failure? How does it differ from static failure?
- What is the endurance limit? Do all materials have one?
- What is an S-N curve? What information does it give a designer?
- Name three factors that reduce fatigue strength.
- Why do fatigue cracks usually start at the surface?
- What is shot peening and how does it improve fatigue life?
- Give three examples of components that fail by fatigue in service.
Scientico India manufactures this and the full range of Strength of Materials equipment — CE-certified and supplied to engineering colleges worldwide.
Explore Strength of Materials Equipment → or request a quote
Lab Equipment Featured in This Guide
Manufactured in-house by Scientico India — ISO 9001:2015 & CE certified, exported to 60+ countries. Request a CIF quote within 24 hours.
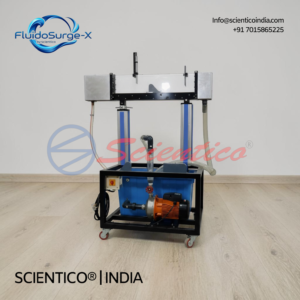 Multi-Purpose Teaching Flume (Length 1m) | FluidoSurge-X 392View details & get quote →
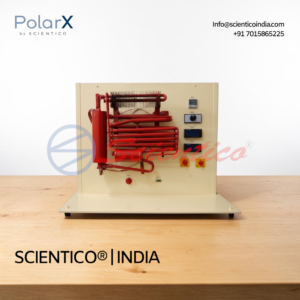 Absorption Refrigeration Trainer | PolarX – 504View details & get quote →
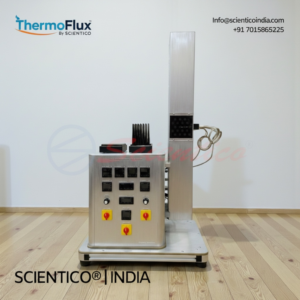 Free and Forced Convection Heat Exchanger | ThermoFlux – 7027View details & get quote →
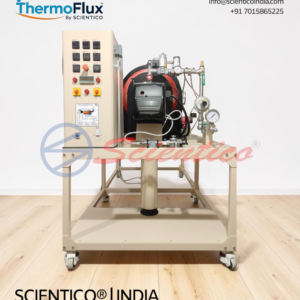 Combustion Laboratory | ThermoFlux – 7081View details & get quote →
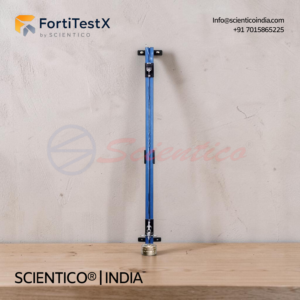 Young’s Modulus Apparatus | FortiTestX-43View details & get quote →
 Flight Demonstration Wind Tunnel | FluidoSurge-X 218View details & get quote →