
The photoelasticity experiment reveals the stress distribution inside a transparent model by viewing it under polarised light in a polariscope, where stress produces coloured fringe patterns. It is a powerful visual method for finding stress concentrations at holes, notches and fillets, and for validating finite-element results.
Equipment mentioned in this guide
Review the product information, specifications and model before requesting a quotation.
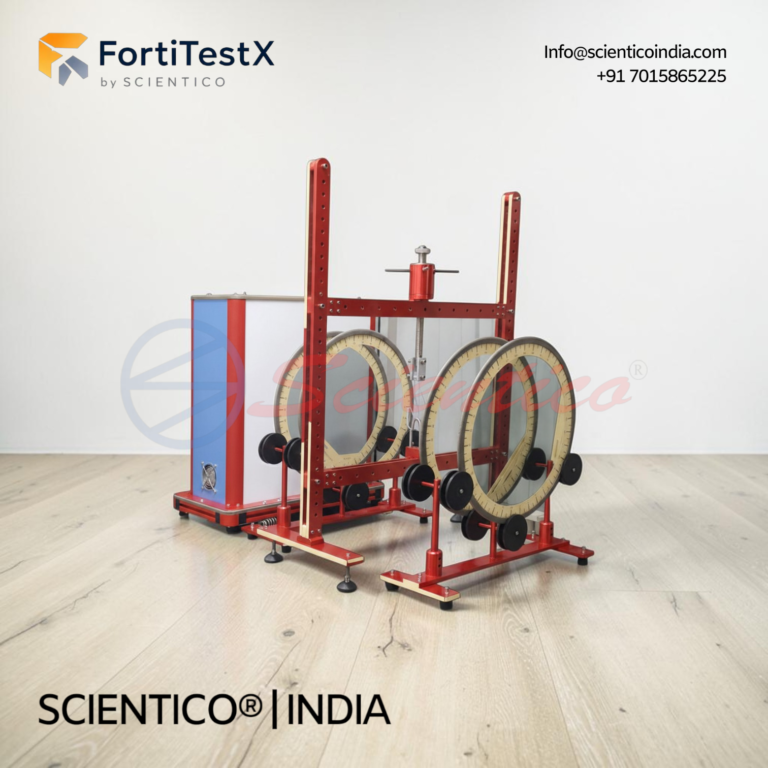
Polariscope | FortiTestX – 19
Polariscope FortiTestX 19 is a dedicated strength of materials lab equipment unit designed for the investigation and measurement of principal stress components and stress directions in photoelastic specimens using the photoelastic method. This Polariscope apparatus uses circularly polarised light passed through transparent, optically double-refractive plastic models under mechanical loading to produce visible fringe patterns representing stress distribution. The FortiTestX 19 supports white light and monochromatic light operation, accommodates six polycarbonate model types, and applies bending, tensile, and compressive loads via a threaded spindle, making it a complete polariscope strength of materials lab equipment unit for undergraduate stress analysis and experimental mechanics programmes.
View product detailsAim of the experiment
To determine the stress distribution and stress concentration in a transparent model using a polariscope, and to apply the stress-optic law.
Theory
Photoelasticity relies on birefringence: certain transparent materials (such as epoxy or polycarbonate) become doubly refracting when stressed. Viewed between crossed polarisers in a polariscope, a stressed model shows coloured fringes. The isochromatic fringes are lines of constant principal-stress difference, given by the stress-optic law:
σ₁ − σ₂ = N · fσ / t
where N is the fringe order, fσ is the material fringe value, and t is the model thickness. The isoclinic fringes give the directions of the principal stresses.
Apparatus required
- Polariscope (plane or circular): light source, polariser, analyser and quarter-wave plates
- Loading frame to stress the model
- Transparent photoelastic models (with holes, notches or fillets)
Procedure
- Place the photoelastic model in the loading frame between crossed polarisers.
- Apply a known load and observe (or photograph) the fringe pattern.
- Count the fringe order N at the points of interest.
- Compute the principal-stress difference from the stress-optic law and locate the regions of highest stress.
Result
Fringe density is highest at stress concentrations, around holes, notches and sharp fillets, giving a direct visual map of where a component is most likely to fail.
Applications
Photoelasticity is used for stress analysis of complex components, validating finite-element models, and teaching stress concentration. It complements destructive tests such as the tensile test on a UTM, hardness testing, and the buckling of columns experiment. See related terms in the engineering lab glossary.
Frequently asked questions
What is photoelasticity?
It is an experimental stress-analysis technique that uses the birefringence of transparent materials to show stress as coloured fringe patterns under polarised light.
What is the stress-optic law?
It relates the fringe order to stress: σ₁ − σ₂ = N · fσ / t, where N is the fringe order, fσ the material fringe value and t the model thickness.
What is the difference between isochromatics and isoclinics?
Isochromatics are fringes of constant principal-stress difference (magnitude); isoclinics give the directions of the principal stresses.
Need this apparatus for your lab? Request a quote from Scientico India, ISO 9001:2015 certified, documentation reviewed per model, exporting to 30+ countries, reply within 24 hours.
What the polariscope selection must make visible
Photoelasticity teaching depends on the optical arrangement, loading frame and specimen set working together. The buyer should define whether the lesson is qualitative fringe observation, stress-concentration comparison or a quantitative exercise. Light source, polarising elements, loading method, specimen geometry and viewing area therefore belong in the same specification.
What to confirm before requesting a quotation
- Name the stress pattern or component geometry to be studied.
- Confirm transmission or reflection arrangement and light-source requirements.
- List specimens, loading accessories and any force indication included.
- Describe safe handling, storage and replacement of optical parts.
For an international order, also state the quantity, destination, electrical supply, documentation, installation or training needs and requested delivery basis. Treat catalogue information as a starting point; the current model page, datasheet and written quotation must confirm the exact configuration.
Polariscope equipment: learning outcome and supplied components
One honest ask
We don't gate anything on this site. You just read the whole thing free. If it was useful, leave your email and two things happen: we send you this page as a plain-text block you can paste into a tender file or an internal email, and we notify you the next time we publish a buyer tool like this one. Nothing else. No drip sequence, no sales calls booked without asking.